|
Butterfly Conservation |
| Saving butterflies, moths and our environment |
| Butterfly Conservation Home Page |
| National Moth Recording Scheme |
| Links to other online moth maps |
|
|
| Loading data - please wait | |||
| Loading data - please wait | |||
| Loading data - please wait | |||
| Scientific name: | |||
| Common name: | |||
| Select year range for maps using sliders: | |||
| Mouse clicks over map find species: | |||
| Loading data - please wait | |||
| Loading data - please wait | |||
| Loading data - please wait | |||
| Loading data - please wait | |||
| Loading data - please wait | |||
| Loading data - please wait | |||
| - | |||
| - | |
The maps and charts produced by this page use the following sets of record data:
A phone version of the maps is also available. It has less functionality than this computer version, but is designed for use on smartphones. If downloaded into a phone's internal memory together with map graphics files swmap.png and swvcmap.png, it can be used 'in the field' in places with no phone signal. The phone version can also be used on a computer.
First wait until the map data has been downloaded from the website into your browser. This can take several seconds, and you will see when it has been completed because the display will then show the 10Km scale species density map. From then onwards you can select and display species maps without any further delays because all the necessary data is already in the browser ready for the maps and charts to be drawn. By default the 10Km scale distribution maps are shown.
To choose a species by name, key in at least 3 characters of the name in either the scientific name box or the common name box. As you type, the number of matching names is shown in the drop-down selection choice box below the name boxes. You can use the selection box to select the species. A unique match results in automatic selection, and the selection box opens automatically if there are at most 5 matches. The name matching can be applied to micro-moths, macro-moths or both, and you can start typing anywhere within the name so, for example, if you type 'red u' into the common name the selection box opens displaying Barred Umber and Red Underwing.
Nomenclature and ordering follows the Checklist of the Lepidoptera of the British Isles (Agassiz, Beavan and Heckford, second edition 2024, with subsequent amendments) in which only scientific names are given for most of the micros. Previously Jim Wheeler's list of common names for the micros (available via the Norfolk Moths website) was used here for most species, but in 2023 a new set of names for most species was published in the Second Edition of the Field Guide to the Micro-moths of Great Britain and Ireland (Sterling, Parsons & Lewington). These maps now give the new common name for micros, followed by "/" and the name previously used, if different. Where the first name is enclosed in **asterisks** the new list name is misleading: "Leaf-miner" for a species which actually mines stems not leaves. You can select a species using its ABH Checklist number instead of part of the species name.
In the 4.035 Stigmella salicis species group, DNA clusters 1, 2, 3 and 6 are now known to occur in the UK. Previously only clusters 1 and 6 were known here, and were separable by the egg position: leaf underside for S. salicis (cluster 1), and upperside for the currently unnamed species (cluster 6). For cluster 2 species the egg is underside, for cluster 3 it is upperside. The mines are noticeably different for clusters 1 and 2, the latter being longer, with a more linear frass line, and (from examination of several examples in Gloucestershire) initially only half-depth and looking green when viewed with backlighting. At present clusters 1, 2 and 6 are known from our region (cluster 2 since 2025, so not mapped here yet). In these maps cluster 6 has been given a temporary checklist number of 4.0351. Once it is named and formally added to the checklist, the changes will be applied to this page at some future update.
You can use the species slider bar above the map to move forwards and backwards through mapped species in Checklist order. Click on the [<<] or [>>] button to move backwards or forwards by one species. Alternatively in some browsers you can use the mouse wheel to scroll through the full set of species maps when the cursor is over the graphics area, or if you scroll the wheel with a [Ctrl] key pressed, it has the same effect as a left or right mouse click as described below. If you scroll the wheel with the [Alt] key pressed and one of the rare/scarce or migrant options is selected, the next mapped species in the selected category is shown.
The initial species density map shows the numbers of species recorded for each 10Km square as one of 15 ranges. This map precedes the first species map when using the slider bar, movement buttons or mouse wheel. To see the total number of moth species mapped for a tetrad (in those parts of the region for which this is available), move the cursor over that tetrad's 10Km square on the map and look at the zoomed area in the bottom right hand corner of the map. With the cursor positioned over a square on the map, you can use mouse clicks to move backwards and forwards through the maps of species recorded from that square and years period, or alternatively through the maps of species not recorded there but recorded in the chosen number of adjacent squares (1 - 8) during the selected period. When showing records from all years this can be used to identify species quite likely to occur in the square but not yet with records in the mapped data. You can restrict this information and movement (and also the species density map) to rare & scarce species or to migrants, and/or to just micros or macros, by selecting the checkboxes. As usual moths in the families Hepialidae, Cossidae, Sesiidae, Limacodidae and Zygaenidae are treated as macros.
If you want to compare distribution maps for two species (or more), or to compare the other types of display, you can use the preset buttons. These are updated automatically as you display different species. To cycle through several species for comparison purposes, select each species in turn then repeatedly click on the lowest button for one of these species. Each time you do this the chosen species is moved back to the top button and the others are shifted down by one position so that you always click the same button to see the next species in the comparison group.
If you copy and paste the map page URL (into an email or a social media message, for example) and append to it the # character and the ABH checklist number for a species, when someone clicks on this URL the page loads displaying the map for that species.
A solid dot on a map indicates that the species was recorded in that square since 2000. The solid blue dots show records from 2000-2009, orange dots show records from 2010-2019 and red dots show the records from 2020 onwards. If the checkbox is selected, dots for any new squares added since 2020 to a species map will flash. A hollow blue-green dot indicates that the most recent record held for the square is pre-2000. You can choose to display the distribution for any of 10 periods: all years, pre-2020, pre-2010, pre-2000, 2000-2009, 2010-2019, since 2020, since 2010, since 2000, or 2000-2019. To change the period use the double slider range bar. Clicking the mouse moves the closer of the two sliders (unless very close to the midpoint between them), and you can then drag it further if necessary to select the desired year period. The year chart is based on all records whichever distribution is displayed. The same period options are available for the initial species density map.
The year chart in the species details panel shows relative numbers of records in 3 date periods per month (1st - 10th, 11th - 20th, and 21st - end). Solid black bars indicate records of adults, open brown bars indicate non-adult records: eggs, larvae, pupae, larval or pupal cases, distinctive feeding signs such as leaf mines etc. Open grey bars indicate unspecified/unavailable/unrecognised record type. Position the mouse pointer over a period in the chart to see the numbers of records for that period. Note: because each type of bar has a minimum height for visibility, a few records of each type can result in a taller combined bar than a lot of records of one type only.
Instead of the 10Km scale species distribution map you can select:
For the species density map both the number of years and date period by year options show a list of the south west region vice-counties, over a blank map. If the VC boundaries map option is selected, the vice-county numbers are also shown on this map.
For protected species only 10Km scale distribution is shown, even if 2Km scale records were available.
Selecting this option shows the Wiltshire and Gloucestershire VCs 7, 8, 33 and 34 at a larger scale so that 2Km tetrad scale distribution for these counties is easier to view. The map is limited to the area east of 10Km grid line 35 and north of grid line 11. The statistics shown for each species are not limited to this map area, but the species density map statistics are because they are calculated as the map is produced for display. The species density map is available at 2Km scale for this area, and the species maps giving the number of years recorded are shown at 2Km scale instead of the 10Km scale shown for the whole region.
UK national status data for our resident macro-moths was updated in 2019 and published in the Atlas of Britain and Ireland's Larger Moths; this uses IUCN regional Red List categories. The status of micro-moths was updated in January 2012 in Butterfly Conservation Report No. S12-02, which uses earlier Red Data Book and Scarce categories. The maps use these published status ratings with few amendments, e.g. following checklist changes.
The abbreviations used here for micro-moths are given in the table below. If selected, the rare & scarce species option includes the categories from RDB1 down to Nb.
| RDB1 | Red Data Book category 1: Endangered species with a single population in one 10Km OS grid square in the UK, or in rapid decline and found in at most 5 10Km squares |
| RDB2 | Red Data Book category 2: Vulnerable species found in at most 10 10Km squares |
| RDB3 | Red Data Book category 3: Rare species found in 11 - 15 10Km squares |
| pRDBn | Provisionally RDBn, yet to be ratified |
| RDBK | Thought to be RDB status, but insufficient knowledge |
| Na | Notable a (Nationally Scarce A): Scarce species found in 16 - 30 10Km squares |
| Nb | Notable b (Nationally Scarce B): Scarce species found in 31 - 100 10Km squares |
| BAP | Biodiversity Action Plan / NERC Act (2006) Section 41 priority species for action. BAP status is independent of any RDB/Na/Nb rating |
| BAP(R) | Biodiversity Action Plan declining species for which research is needed |
| Local | Species found in 101 - 300 10Km squares |
| Common | Species found in more than 300 10Km squares |
| Migrant | Occurs as a result of immigration; may have colonised in the UK |
| Adventive | Occurs as a result of accidental or deliberate import; may have colonised |
The abbreviations used here for macro-moths are given in the table below. Most migrants, adventives and those long extinct in the UK were not assessed in the 2019 review, and their status is described on their map. For macros, the rare & scarce species option includes resident & colonising species recorded from at most 100 UK 10Km squares in 2000-2016.
| RE | Regionally Extinct. No confirmed records in Great Britain and Ireland for many years |
| CR(PE) | Critically Endangered, Possibly Extinct. Threatened by extremely high risk of regional extinction |
| CR | Critically Endangered. Threatened by extremely high risk of regional extinction |
| EN | Endangered. Threatened by very high risk of regional extinction |
| VU | Vulnerable. Threatened by high risk of regional extinction |
| NT | Near Threatened. Close to qualifying for one of the threatened categories and/or likely to qualify for one in the near future |
| LC | Least Concern. |
| DD | Data Deficient. Status uncertain because of insufficient data on abundance and/or distribution |
The threat ratings above do not necessarily indicate scarcity or rarity, nor vice-versa. Some currently widespread but formerly more abundant species have suffered such long-term population declines that they are rated NT or VU. Some scarce or rare species are not considered to be under threat now or in the near future, and so they are rated LC. Rare, Scarce (A) & Scarce (B) ratings have been included for macros based on the recorded number of 10Km squares in 2000-2019: up to 15, 16-30 and 31-100 respectively. Some species labelled as migrants are resident in the Channel Islands.
For some species a comment is shown below its year chart. The typical UK larval food information shown below the map is derived from several sources, and is probably incomplete &/or inaccurate for a number of species.
In square brackets after the species status, microlepidoptera verification gradings issued by Butterfly Conservation in early 2016 and revised in 2025 are given. These consist of gradings for identification of adults (except for many of the Nepticulidae which are considered too similar in appearance), for larval cases of those species which construct them, or for leaf mines of those species which make them. The gradings below are copied from the BC Guidance document, which contains additional guidance. The species gradings shown on the maps are copied from the Spreadsheet which also contains comments on some species which in some cases limit the applicability of the grading. For species with comments, the + character follows the grading(s) and the comment is shown below the map. NB For a few species it was appropriate to change the gradings &/or comments from the original versions, e.g. because of recently-discovered similar-looking species.
In square brackets after the species status, macrolepidoptera verification gradings from BC's UK Macro-moth Verification Grade Guidelines V1.0.1 (May 2021) are given. Comments based on local experience have been provided for some species.
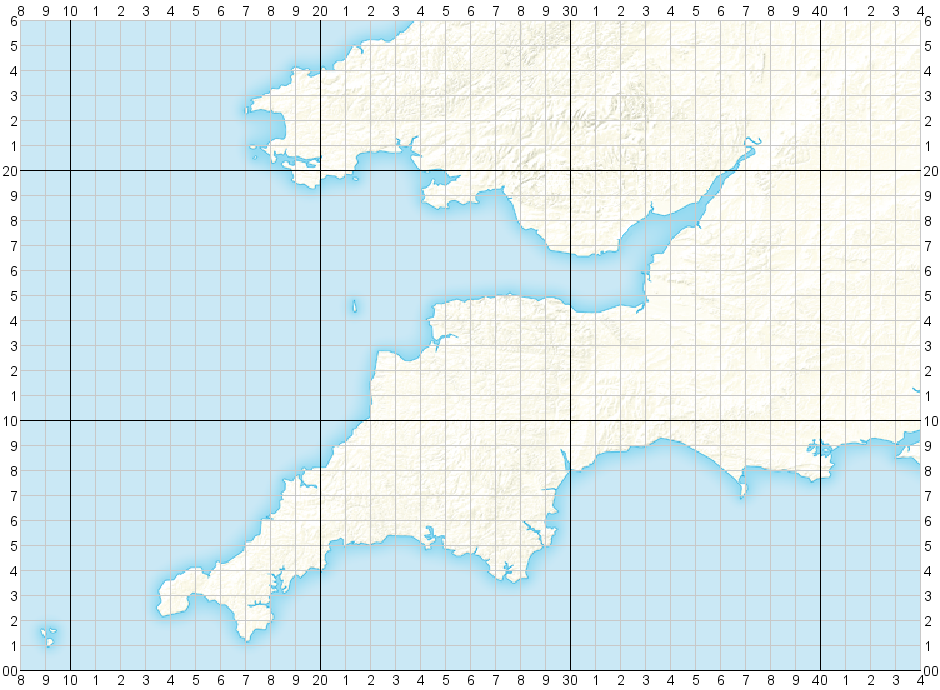
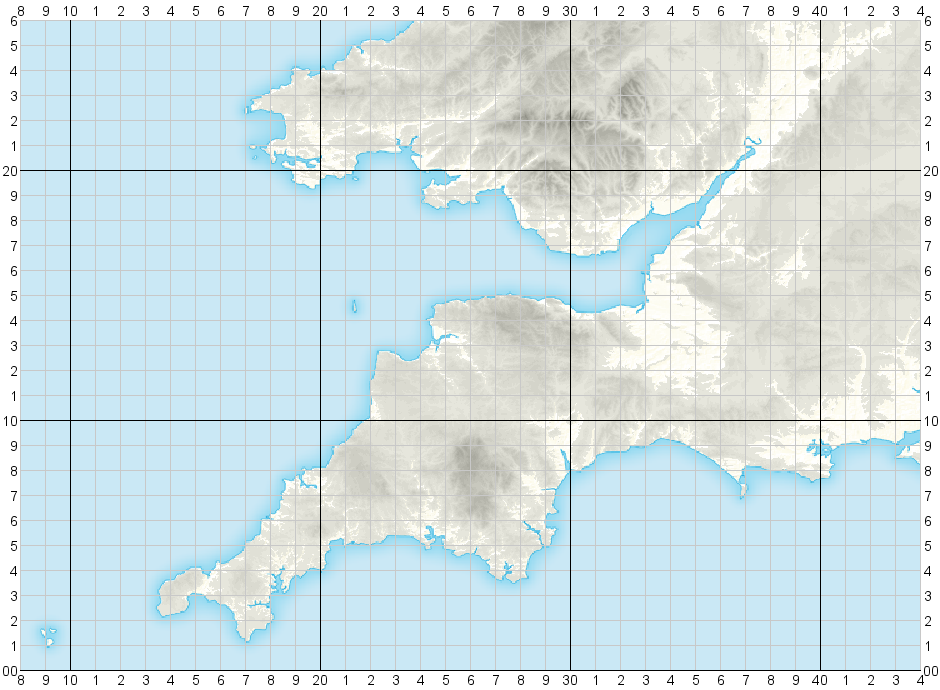
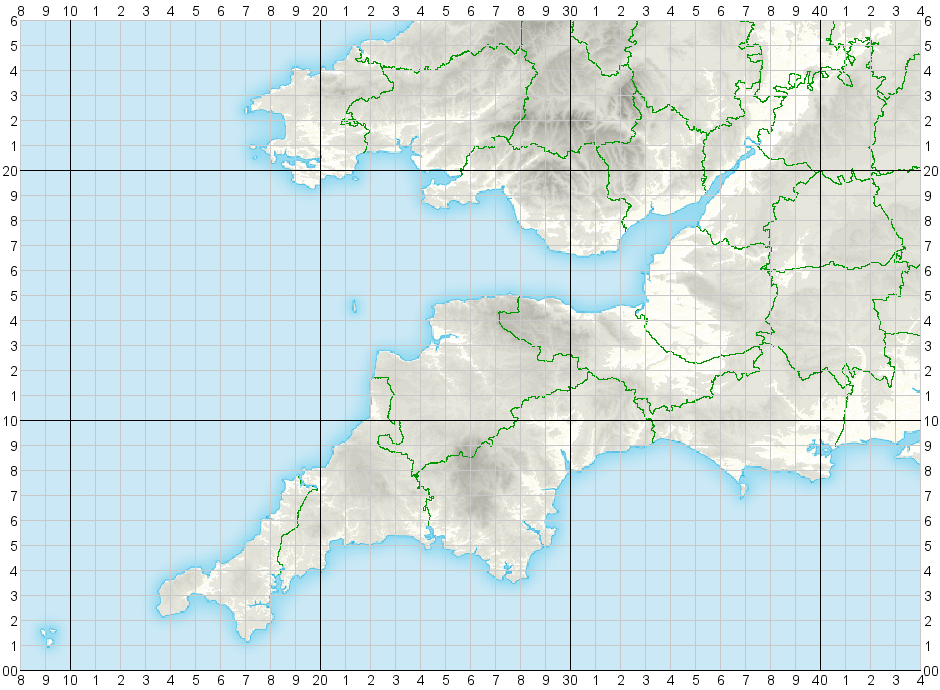
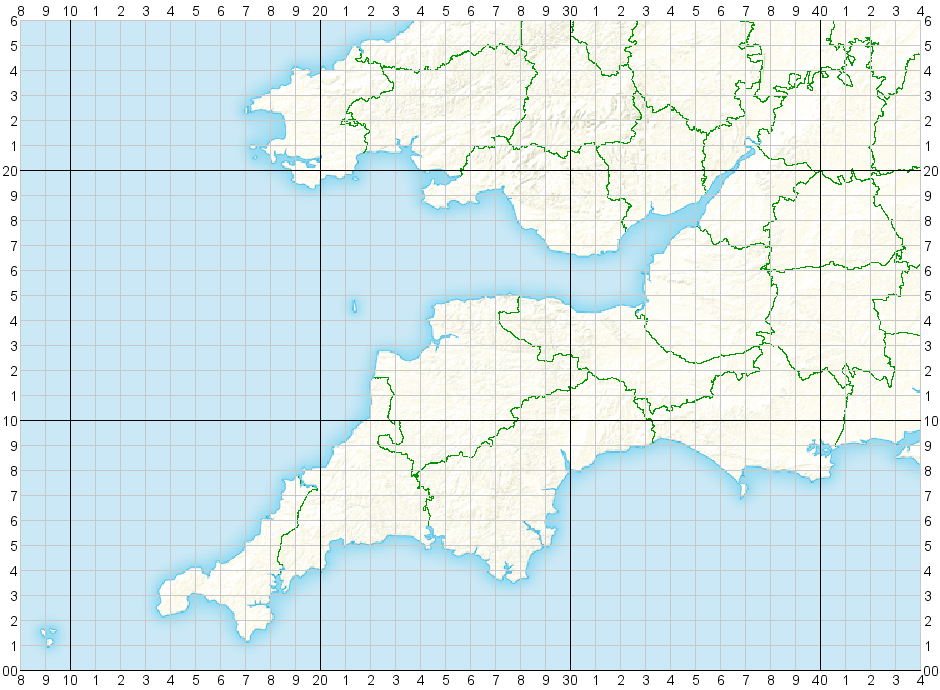
Gradings for verification of adult macro-moth records are on a scale of 1 to 4, defined as:The background map shows Ordnance Survey 10Km grid lines, labelled around the map margin. The altitude shading option shows altitudes above 50 metres in increasingly darker 50 metre shades of grey for increasing altitude. The VC boundaries option displays the vice-county boundaries in green. The VC boundary data, the altitude data from which the shading was calculated and the UK map from which the underlying region map was produced are covered by the Ordnance Survey Open Data Licence, contains OS data � Crown copyright and database rights (2003, 2018, 2022).
If you have any colour blindness and find that some of the five dot colours used on the various displays are difficult to tell apart, you can select alternative colours which you can save to a cookie so that they are used automatically in future, if your browser settings allow this. Click the [Settings] button to open the colour selection panel which contains instructions.
You can set a 'home tetrad' which will be highlit on the maps, and also used by the optional voice output to report on whether each selected species was recorded in that tetrad during the selected years period. You can set/change/cancel the home tetrad with/without voice reports by clicking over a new tetrad with [Shift] or [Ctrl] pressed to set it ([Ctrl] for voice reports), or over the current home tetrad to cancel it. You do not need to open the Settings panel to do this, but you do need to use that panel if you want to save any changes to the settings cookie.
If you save your chosen settings to a cookie it will expire after 400 (default) or 100 days and it is not renewed automatically, but you can save the settings at any time to reset the expiry date. You can also click on a buttom to delete the settings cookie. If you try to save the settings but the colours are not shown in the 'Saved' column and the cookie expiry date is not displayed, your browser did not save and check the cookie successfully.
These maps are produced by a volunteer member of Butterfly Conservation, Gloucestershire Branch. There is no guarantee of complete accuracy in terms of the species recorded, their locations and dates. The known difficulties of accurate identification in some species groups means that some errors are highly likely in maps and charts derived from millions of records. The maps show older and historical records of some difficult to identify species which may lack the verification evidence now advised for those species. When errors or uncertain records are identified and removed from any of the source datasets, these maps might not necessarily be corrected for a long time, or not at all if the revised datasets are not supplied/available to enable this. Even in areas where large quantities of reasonably up to date records were available there is no guarantee of completeness of distribution displays. With records taken from several sources some records may be duplicates, affecting the values shown on the time of year charts, although the data was pre-processed to detect and ignore possible duplicates.
Use of this web page is entirely at your own risk. No liability is accepted for any indirect, consequential or incidental loss or damage arising from its use. It has been developed and tested using the Chrome browser.
Page last revised March 2026
Butterfly Conservation. Company limited by guarantee, registered in England (2206468).
Registered Office: Manor Yard, East Lulworth, Wareham, Dorset, BH20 5QP.
Charity registered in England and Wales (254937) and in Scotland (SCO39268). VAT No GB 991 2771 89