|
Butterfly Conservation |
| Saving butterflies, moths and our environment |
| Butterfly Conservation Home Page |
| National Moth Recording Scheme |
| Gloucestershire Moth Maps |
|
|
| Loading data - please wait | |
| Loading data - please wait | |
| Scientific name: | |
| Common name: | |
| Mouse clicks over 10Km map find species: | |
| Loading data - please wait | |
| Loading data - please wait | |
| Loading data - please wait | |
| Loading data - please wait | |
| Loading data - please wait | |
| Loading data - please wait | |
| Any data loading failure is shown here | |
These maps use the following sets of record data:
The maps demonstrate what could be produced if all the data were made available.
Records of a few of the rarest macro-moth species were excluded from the NBN dataset, which included micro-moth records for some vice-counties. Any known pre-2000 macro-moth distributions missing from these maps may indicate coverage gaps in the data held by Butterfly Conservation at the time the dataset used here was uploaded by BC to the NBN. There was also a technical problem which resulted in records for a small number of species not being uploaded for some vice-counties.
This version of the distribution maps has a number of map options which are described below. A similar but 10Km only version is available, and also two much simpler versions which have been designed for use with phones (though they can also be used on a computer).
All versions have been used with the Chrome browser on a computer, and the phone version with Chrome on an Android phone. Please read the Disclaimer section below.
First wait until the map data has been downloaded from the website into your browser. This can take several seconds, and you will see when it has been completed because the display will then show the species density map. From then onwards you can select and display species maps without any further delays because all the necessary data is already in the browser ready for the maps and charts to be drawn.
To choose a species by name, key in at least 3 characters of the name in either the scientific name box or the common name box. The number of matching names is shown in the drop-down selection choice box below the name boxes; use this to select the species. A unique match results in automatic selection, and the selection box opens automatically if there are at most 6 matches. The name matching can be applied to micro-moths, macro-moths or both.
Scientific names and ordering follows the Checklist of the Lepidoptera of the British Isles (Agassiz, Beavan and Heckford, 2013 and subsequent amendments) except for any species included here but not yet added to the checklist in a published amendment. Common names for macro-moths also follow the checklist, except for some species with more than one name (in some cases for subspecies or forms). For such species those alternative names which are also shown in the 2019 Atlas of Britain and Ireland's Larger Moths are used here. For most of the micro-moths, the checklist does not provide common names so here the names from Jim Wheeler's list (version 1.7 October 2019, downloaded from his website) are used for almost all species.
Any part of the name can be used and matching is not case-sensitive, so for example entering "tig" in the common name box gives a list of the Tiger moths if macros or both micros and macros are selected. Moths in the families Hepialidae, Cossidae, Sesiidae, Limacodidae & Zygaenidae are treated as macros rather than as micros for name matching purposes.
Only those species in the main section of the ABH checklist are mapped here, together with any expected additions for which records were available for mapping. Species in the checklist appendices are excluded. No 10Km distribution is shown for New Forest Burnet, to protect its Scottish site, and no 2Km distribution is shown for other protected species.
You can use the species slider bar above the map to move forwards and backwards through mapped species in Checklist order. Click on the [<<] or [>>] button to move backwards or forwards by one species.
Alternatively in some browsers you can use the mouse wheel to scroll through the full set of species maps when the cursor is over the graphics area, or through the set of matching species when the cursor is over the matching names selection box.
The initial map shows the numbers of species recorded for each 10Km square. This map precedes the first species map when using the slider bar, movement buttons or mouse wheel. To see the total number of moth species mapped for a square, move the cursor over that square on the map. With the cursor positioned over a square on the map, you can use mouse clicks (un[Shift]-ed) to move backwards and forwards through the maps of species recorded from that square in the selected years period, or alternatively move through the maps of species not recorded there but recorded in at least the chosen number of adjacent squares (1 - 8) during the selected period. This can be used to identify those species not yet recorded in a particular square but which are quite likely to be present there.
If you want to compare maps for two species (or more), you can use the preset buttons. These are updated automatically as you display different maps. To cycle through several maps for comparison purposes, select each map in turn then repeatedly click on the lowest button for one of these species. Each time you do this the chosen species is moved back to the top button and the others are shifted down by one position so that you always click the same button to see the map for the next species in the comparison group.
You can choose to display the distribution for any of 9 periods: all years, pre-2020, pre-2010, pre-2000, 2000-2009, 2010-2019, 2020, 2010-2020 or 2000-2020. To change this you can use the drop-down list in the period selection choice box, and in some browsers you can also use the mouse wheel when the cursor is over this box. The same period options are available for the initial species density map.
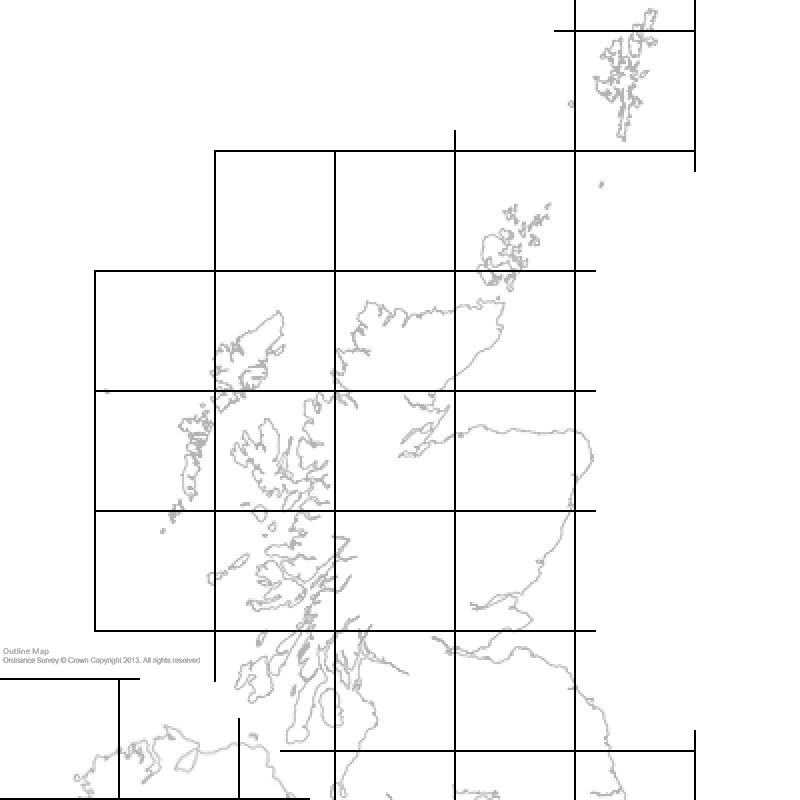
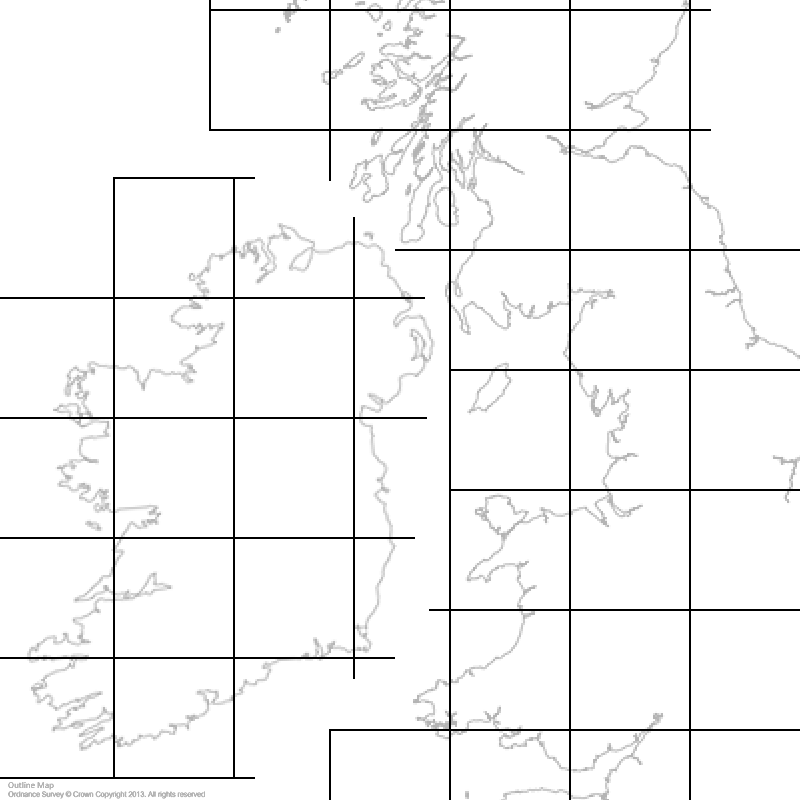
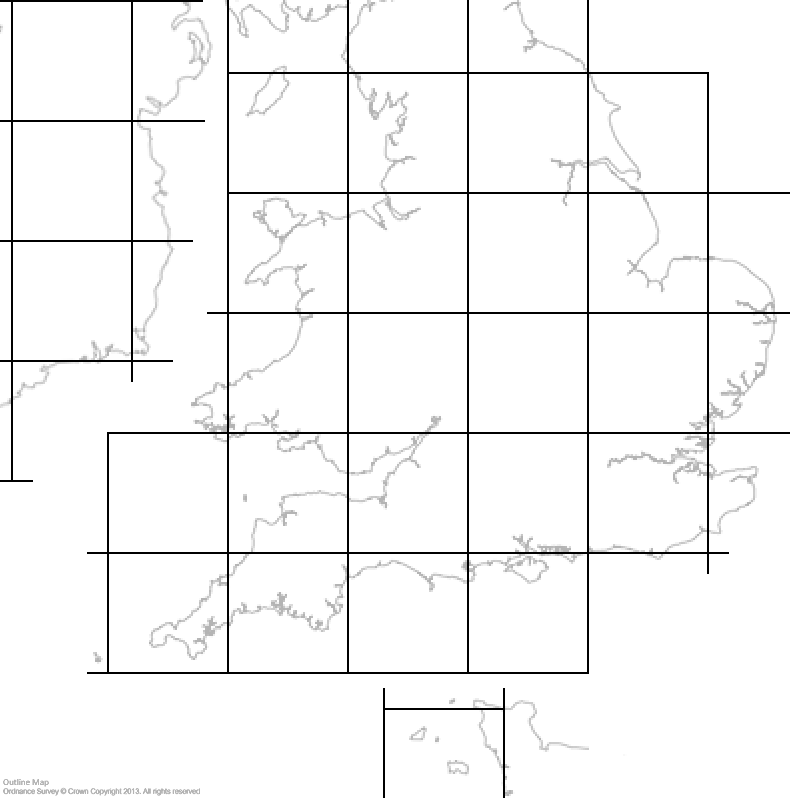
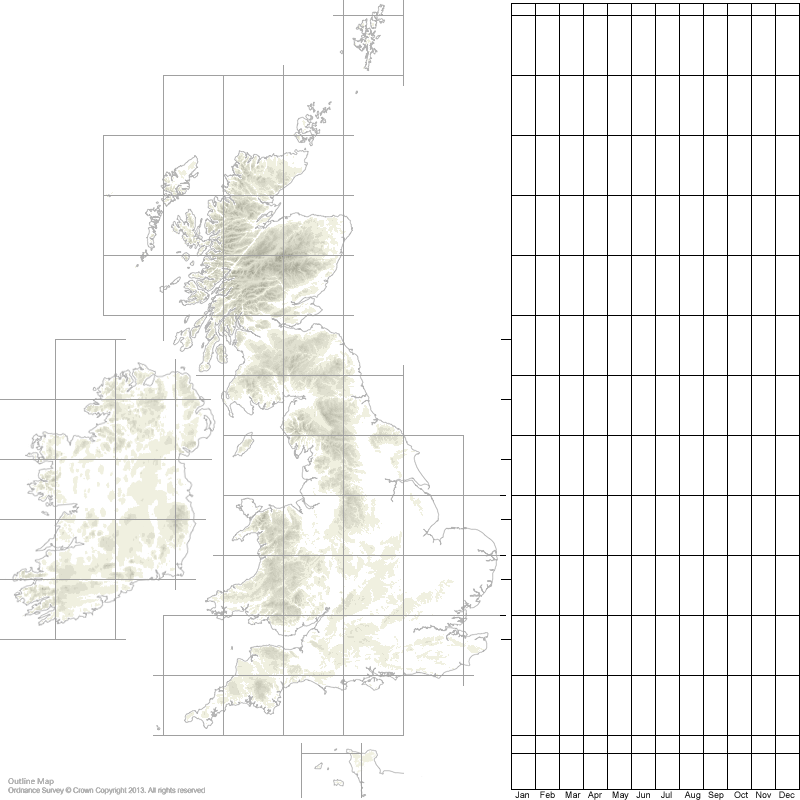
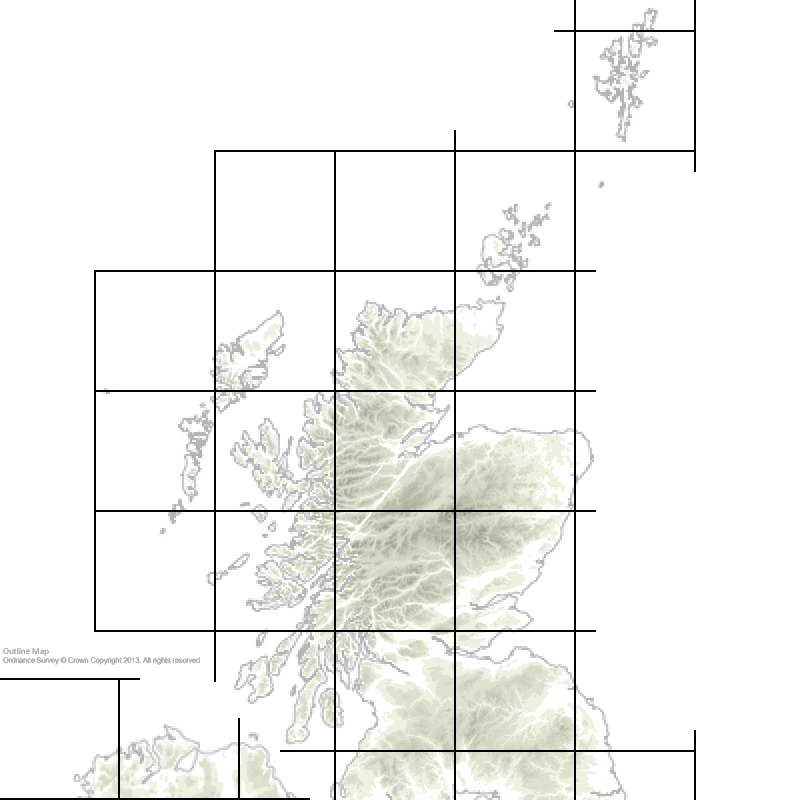
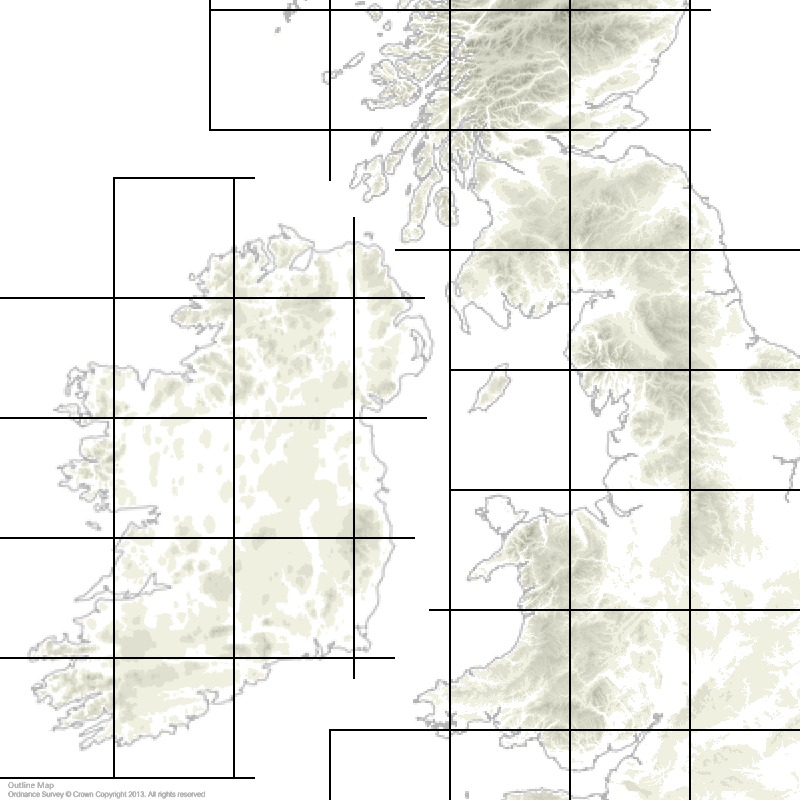
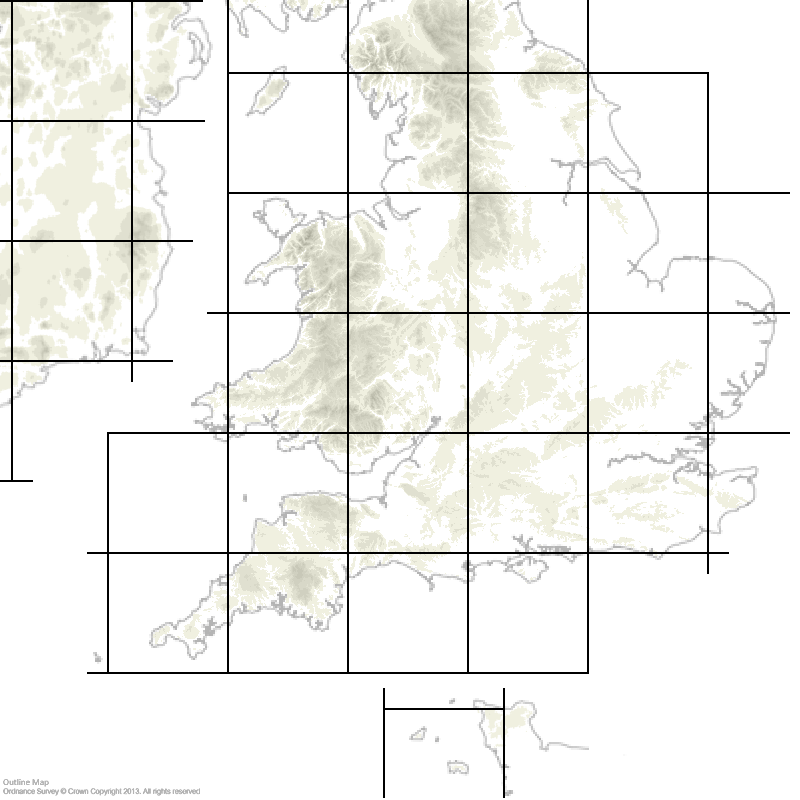
Instead of the whole area map and latitude chart, northern, western and southern sections of the map can be shown at a larger scale to make it easier to see the distribution in one area. Altitude shading is available on species maps; this is based on open data from Ordnance Survey (for England, Scotland & Wales, contains OS data © Crown copyright and database right 2018) and from the EU Open Data Portal: the EEA Elevation map of Europe.
After selecting a 10Km square by [Shift]-click over the map you can display the tetrad distribution in an area centred on that square, using the radio button below West, North and South buttons. The area covered is a square of size 70Km initially, with zooming out to 90Km, 110Km, 160Km, 210Km and 290Km also being selectable. The four buttons [<<<] [>>>] [^^^^] [vvvv] move the map left, right, up and down respectively (if such a move is not prevented because of the current selection position). You can also scroll the mouse wheel over these controls to change the tetrad map size or move the map. Over the left and right buttons, scroll the wheel downwards to move in that direction, upwards to reverse the direction. Over both the up and down buttons, scroll the wheel downwards to move the map down, upwards to move the map up.
No tetrad distribution is shown for protected species.
You can make the map display start at tetrad scale in a selected area by specifying this at the end of the web page URL address. Append the # character followed by the tetrad map size (70, 90, 110, 160, 210, 290 or 370) and the 10Km square grid reference. So for example, appending #90SO81 shows a 90x90 Km tetrad map centred on Gloucester. If you append just the 10Km square reference without the map size (e.g. #SO81), the display starts with the whole map and latitude chart, and pairs of horizontal and vertical lines drawn to highlight the selected 10Km square. You can also append the ABH checklist number of a species (after the tetrad scale and 10Km square reference) so that the page loads displaying the map for that species, e.g. appending #90SO81ABH70.061, or just #ABH70.061 to display the map for Common Carpet.
The tetrad maps can display Vice-county boundaries. The England, Scotland and Wales data for these was obtained from the National Biodiversity Network, under the terms of the OS Open Data Licence. Contains OS data © Crown copyright and database rights (2003). The data for Ireland was obtained from GitHub (https://github.com/SK53/Irish-Vice-Counties) under the Open Data Commons Open Database Licence (ODbL), attribution: © 2015 Open Street Map contributors.
For many species a comment is shown below its map. In most cases this is taken from the microlepidoptera verification gradings issued by Butterfly Conservation in early 2016. These consist of gradings for identification of adults (except for many of the Nepticulidae which are considered too similar in appearance), for larval cases of those species which construct them, or for leaf mines of those species which make them. The gradings below are copied from the BC Guidance document, which contains additional guidance. The species gradings shown on the maps are copied from the Spreadsheet which also contains comments (included here) on some species which in some cases limit the applicability of the grading. NB For a few species it was necessary to change the gradings &/or comments from the original versions.
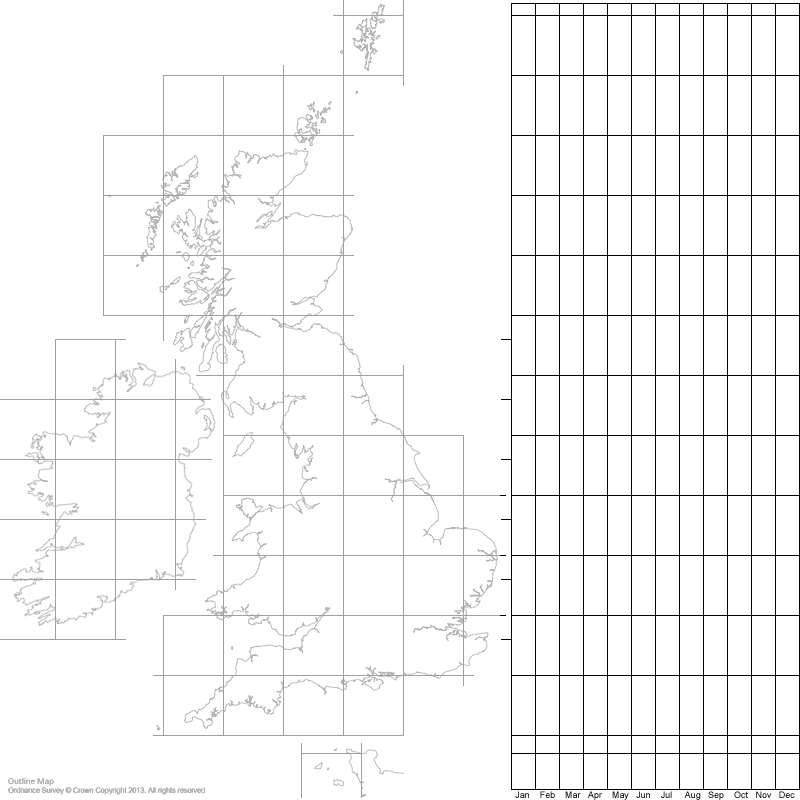
The chart to the right of the whole area map shows numbers of records for each 10Km of latitude in 4 date periods per month (1st - 7th, 8th - 15th, 16th - 23rd and 24th - end). Adjustments were made to the outline map to align with the chart, rotating Ireland and slightly shifting the Channel Isles. The tick marks outside the left edge of the chart indicate Irish 100Km grid lines.
The chart uses either pre-2010 or 2010-2020 records; you can click the Chart: button to swap between these two periods in order to see any changes in phenology (if sufficient data is available to show this). For these demonstration maps, there is some potential repeat counting of records received from more than one source, which could affect the charts. Ideally the maps would be produced from a single database with no duplicate records.
Time of year by latitude includes records of non-adult stages, but these could be excluded from the chart if records are made available with stage data. Even with records of early stages on the charts, for most species the charts indicate the main flight period(s) for adults. This clearly shows how some species are bivoltine in the south and univoltine in the north. The charts also show how some spring or early summer species emerge noticeably later in the north whilst some autumnal or winter species emerge earlier in the north. Later emergence in the north applies to some high summer species (e.g. July Highflyer, Barred Yellow, Minor Shoulder-knot) whilst earlier emergence in the north also applies to some summer species (e.g. Orange Swift, Six-striped Rustic).
You can change the dot colours used on the distribution maps, the species density map and the latitude charts, and the changes can be saved to a cookie (if your browser settings allow this) so that they are loaded automatically when you visit the page. Click on the [Colours] button in the top left corner to open a colour selection panel which includes instructions.
Below the map you can produce species lists for 10Km squares. [Shift]-click on a square on the map to select it. Using the map options, choose the years period for the list, whether to include micros, macros or both, and whether to list species recorded in the 10Km square or alternatively "target" species not recorded in that square but recorded in at least the selected number (from 1 to 8) of adjacent 10Km squares during the selected years period. Use the radio buttons above the species list text area to choose between scientific or common names or both, and the separator character between items in each list entry. Then click on the Make species list button.
When you first select a 10Km square it is highlit on the map by pairs of horizontal and vertical lines. [Shift]-click on the same square to leave it selected but remove these lines.
Species lists can be viewed in the text area which should be scrollable. Page searches using Ctrl-f should find entries in the list. The number of species entries in the list is given at the bottom of the list. The list can be downloaded to a file on your computer by clicking the Download species list button; the default filename is set using the 10Km square reference, the years period, any restriction to micros or macros, and the adjacency requirement if that option is selected.
UK national status data for our resident macro-moths was updated in 2019 and published in the Atlas of Britain and Ireland's Larger Moths; this uses IUCN regional Red List categories. The status of micro-moths was updated in January 2012 in Butterfly Conservation Report No. S12-02, which uses earlier Red Data Book and Scarce categories. The maps use these published status ratings with few amendments, e.g. following checklist changes.
The maps also show Biodiversity Action Plan / NERC Act (2006) Section 41 priority species for action, and Biodiversity Action Plan declining species for which research is needed, as BAP and BAP(R) respectively, preceding the species status.
The status abbreviations used here for micro-moths are given in the table below.
| RDB1 | Red Data Book category 1: Endangered species with a single population in one 10Km OS grid square in the UK, or in rapid decline and found in at most 5 10Km squares |
| RDB2 | Red Data Book category 2: Vulnerable species found in at most 10 10Km squares |
| RDB3 | Red Data Book category 3: Rare species found in 11 - 15 10Km squares |
| pRDBn | Provisionally RDBn, yet to be ratified |
| RDBK | Thought to be RDB status, but insufficient knowledge |
| Na | Notable a (Nationally Scarce A): Scarce species found in 16 - 30 10Km squares |
| Nb | Notable b (Nationally Scarce B): Scarce species found in 31 - 100 10Km squares |
| Local | Species found in 101 - 300 10Km squares |
| Common | Species found in more than 300 10Km squares |
| Migrant | Occurs as a result of immigration; may have colonised in the UK |
| Adventive | Occurs as a result of accidental or deliberate import; may have colonised |
The IUCN threat category abbreviations used here for macro-moths are given in the table below. Most migrants, adventives and those long extinct in the UK were not assessed in the 2019 review, and their status is described on their map.
| RE | Regionally Extinct. No confirmed records in Great Britain and Ireland for many years |
| CR(PE) | Critically Endangered, Possibly Extinct. Threatened by extremely high risk of regional extinction |
| CR | Critically Endangered. Threatened by extremely high risk of regional extinction |
| EN | Endangered. Threatened by very high risk of regional extinction |
| VU | Vulnerable. Threatened by high risk of regional extinction |
| NT | Near Threatened. Close to qualifying for one of the threatened categories and/or likely to qualify for one in the near future |
| LC | Least Concern. |
| DD | Data Deficient. Status uncertain because of insufficient data on abundance and/or distribution |
The threat ratings above do not necessarily indicate scarcity or rarity, nor vice-versa. Some currently widespread but formerly more abundant species have suffered such long-term population declines that they are rated NT or VU. Some scarce or rare species are not considered to be under threat now or in the near future, and so they are rated LC. Rare, Scarce (A) & Scarce (B) ratings have been included for macros based on the recorded number of 10Km squares in 2000-2016: up to 15, 16-30 and 31-100 respectively. Some species labelled as migrants are resident in the Channel Islands.
There is no guarantee of complete accuracy in terms of the species recorded, their locations and dates. The known difficulties of accurate identification in some species groups means that some mistakes are highly likely in maps, charts and species lists derived from millions of records. Even in areas where reasonably up to date records were available there is no guarantee of completeness of distribution displays. With records taken from several sources some records may be duplicated, perhaps affecting the time of year by latitude charts.
Use of this web page is entirely at your own risk. No liability is accepted for any indirect, consequential or incidental loss or damage arising from its use. There is no guarantee that the scripting which loads the map and chart data and which uses it to construct the displays and species lists will run without causing any problems in a particular browser on a particular device. You are advised to ensure that any work (document editing, etc) has been saved before making use of this page, and to avoid opening more than one version/copy of this page simultaneously.
Page last revised May 2022
Butterfly Conservation. Company limited by guarantee, registered in England (2206468). Registered Office: Manor Yard, East Lulworth, Wareham, Dorset, BH20 5QP.
Charity registered in England and Wales (254937) and in Scotland (SCO39268). VAT No GB 991 2771 89