|
Butterfly Conservation |
| Saving butterflies, moths and our environment |
| Butterfly Conservation Home Page |
| National Moth Recording Scheme |
| BC Gloucestershire Branch Home Page |
|
|
| Loading data - please wait | |||
| Loading data - please wait | |||
| Loading data - please wait | |||
| Scientific name: | |||
| Common name: | |||
| Mouse clicks over map find species: | |||
| Loading data - please wait | |||
| Loading data - please wait | |||
| Loading data - please wait | |||
| Loading data - please wait | |||
| Loading data - please wait | |||
| Loading data - please wait | |||
| Altitude: Shading | |||
| - | |||
| - | |
| (For macros these start with GB & NI maps to 2019 at 2Km scale centred on Glos., for micros they are GB & I Vice-county maps to 2024) | |
| (if that site uses the same scientific name for the species) | |
| or more times | |
| as during | |
See also the Gloucestershire Moth Species Lists
Species list pages are available for Rough Bank Reserve,
Daneway Banks NR,
Lower Woods NR and
Dymock Woods.
There are pages showing the Earliest and Latest mapped adult records for each species,
and species Gains and Losses since 2000 from the area.
Links to online moth maps for other areas, and some national maps.
GB & Northern Ireland at 2Km & 10Km scales for macros &
butterflies (records to 2019), with VC maps to 2024 for micros.
South West England Region at 10Km scale with 2Km scale data for Gloucestershire,
Wiltshire and the Bristol area.
Gloucestershire Butterfly Distribution Maps are also available.
This version of the distribution maps has a number of map options which are described below. A simpler version without some of these options is also available, and it has been designed for use with phones (though it can also be used on a computer).
To show a species map, key in at least 3 characters of the scientific or common name in the appropriate box. Nomenclature and ordering follows the Checklist of the Lepidoptera of the British Isles (Agassiz, Beavan and Heckford, second edition 2024, with subsequent amendments) in which only scientific names are used for most of the micro-moths. For some years Jim Wheeler's list of common names for the micros (available via the Norfolk Moths website) has been used here for most species, but in 2023 a new set of names for most species was published in the Second Edition of the Field Guide to the Micro-moths of Great Britain and Ireland (Sterling, Parsons & Lewington). Since then a draft revision of the Natural History Museum's UK Species Inventory (UKSI) has revised a few names and provided names for a number of adventive species. These maps now give the new name for micros, followed by "/" and a name previously used, if different. Where the first name is enclosed in **asterisks** the new name is misleading: "Leaf-miner" for a species which actually mines stems not leaves.
If there is a unique match for the partial name, the appropriate map is displayed. If there are more matches, the number of matches is shown and you can select any of the matching names from the resulting list in the name selection box which opens automatically if there are at most 6 matches. Any part of the name can be used, so for example entering "tig" in the common name boc gives a list of the Tiger moths. Alternatively you can enter either the ABH Checklist number in either box instead of part of the species name (or enter 0.0 for the species density map).
In the 4.035 Stigmella salicis species group, DNA clusters 1, 2, 3 and 6 are now known to occur in the UK. Previously only clusters 1 and 6 were known here, and were separable by the egg position: leaf underside for S. salicis (cluster 1), and upperside for the currently unnamed species (cluster 6). For cluster 2 species the egg is underside, for cluster 3 it is upperside. The mines are noticeably different for clusters 1 and 2, the latter being longer, with a more linear frass line, and (from examination of several examples in Gloucestershire) initially only half-depth and looking green when viewed with backlighting. At present clusters 1, 2 and 6 are known from our area. In these maps cluster 6 is temporarily named Stigmella sp. and numbered 4.0351 (as in recent years), cluster 2 found here in 2025 is named Stigmella salicis-cluster2 and numbered 4.0352. Once these two species are formally assigned specific names and added to the checklist, the changes will be applied to this page at some future update.
You can choose to search on larval food by entering at least 3 characters in either name box and clicking on the 'Find food matches' button. This will only find those species for which the food you enter is listed explicitly below the species map. There may be other matching species for which the food is not listed, e.g. those which use many foods including that one.
You can use the species slider bar above the map to move forwards and backwards through mapped species in Checklist order. Click on the [<<] or [>>] button to move backwards or forwards by one species. Alternatively in some browsers you can use the mouse wheel to scroll through the full set of species maps when the cursor is over the graphics area, or if you scroll the wheel with a [Ctrl] key pressed, it has the same effect as a left or right mouse click as described below. If you scroll the wheel with the [Alt] key pressed and one of the rare/scarce, locally scarce or migrant options is selected, the next species in the selected category is shown.
The initial map shows the numbers of species recorded for each tetrad (2Km square) as one of 10 ranges. This map precedes the first species map when using the slider bar, movement buttons or mouse wheel. To see the total number of moth species mapped for a tetrad, move the cursor over that tetrad on the map. Numbers of micro and macro moth species are shown in brackets. For a species map the earliest and most recent year it was recorded in the tetrad and mapped is also shown. With the cursor positioned over a tetrad on the map, you can use mouse clicks to move backwards and forwards through the maps of species recorded from that tetrad and years period, or alternatively through the maps of species not recorded there but recorded in the chosen number of adjacent squares (1 - 8) during the selected period. You can restrict this information and movement (and also the species density map) to rare & scarce species, or to locally scarce species, and/or to just micros or macros, by selecting the checkboxes. Movement (but neither information nor the species density map) can also be restricted to migrants. As usual moths in the families Hepialidae, Cossidae, Sesiidae, Limacodidae and Zygaenidae are treated as macros. Locally scarce species are selected by specifying the maximum number of tetrads (from 1 - 10) from which they have been recorded during the selected years period.
The species density map can be limited to showing the totals of those species which have been recorded in each tetrad and at a selected time of year anywhere in the mapped area. For a normally well-recorded site this can indicate a time of year when it is not so well recorded. The minimum number of records in the period for a species to be included can be set from 1 to 10, and the qualifying records can be limited to those of adult moths or to those of early stages & larval feeding signs.
If the option is selected by clicking on the vertical bar at the right edge of the parameter selection area, another image area is opened up and tetrad or 10Km maps for the previous two, four or six species are shown at half-size in this area. Ignore this option if it makes the display wider than you want it to be. To close the half-size maps, click on the vertical button with < marks (or anywhere else over those maps), to widen it for display of four or six half-size maps, click on the vertical button with > marks.
If you want to compare distribution maps for two species (or more) at full size, or to compare the other types of display, you can use the preset buttons. These are updated automatically as you display different species. To cycle through several species for comparison purposes, select each species in turn then repeatedly click on the lowest button for one of these species. Each time you do this the chosen species is moved back to the top button and the others are shifted down by one position so that you always click the same button to see the next species in the comparison group.
If you copy and paste the URL for this page (into an email or a social media message, for example) and append the # character followed by the checklist number for a species to the URL, when someone clicks on this URL the page loads displaying the map for that species.
. To change the period use the double slider range bar. Clicking the mouse moves the closer of the two sliders (unless very close to the midpoint between them), and you can then drag it further if necessary to select the desired year period. The year chart is based on all records whichever distribution is displayed. The same period options are available for the initial species density map.
If the checkbox is selected, positioning the cursor over a 10Km square in the recording area for a species distribution map (tetrad or 10Km scale) with 25 or more tetrads mapped since 2000 will replace the dot statistics box with a box showing the 1Km scale distribution for that 10Km square.
If the checkbox is selected, for macro-moths the tetrad distribution outside Glos./VC33/VC34 is also shown, with data to 2019 which BC made available via NBN Atlas in 2023. The dots are semi-transparent, and are not included in the dot statistics.
When a species is selected, you can display its South West England distribution map in a new tab or window (depending on your browser) by clicking the button below the map display. Note that the SW maps display red dots for all post-2020 records, not just the most recent year. This is because the most recent year available for the SW maps can vary from county to county. The SW maps show some records for Gloucestershire which are not shown on the Glos. maps. These are mostly historical 10Km scale records, and the 10 Km scale display on this Glos. maps page is built from records at 2Km or finer scale so it does not show such 10Km scale records.
If you have any colour blindness and find that some of the five dot colours used on the various displays are difficult to tell apart, you can select alternative colours which you can save to a cookie so that they are used automatically in future, if your browser settings allow this. Click the [Settings] button to open the colour selection panel which contains instructions. The high ground shading colour can also be changed and saved using this panel.
You can set a 'home tetrad' which will be highlit on the maps, and also used by the optional voice output to report on when each selected species was last recorded in that tetrad. You can set/change/cancel home tetrad with/without voice reports by clicking over a new tetrad with [Shift] or [Ctrl] pressed to set it ([Ctrl] for voice reports), or over the current home tetrad to cancel it. You do not need to open the Settings panel to do this, but you do need to use the panel if you want to save any changes to the settings cookie.
If you save your chosen settings to a cookie it will expire after 100 (default) or 400 days and it is not renewed automatically, but you can save the settings at any time to reset the expiry date. You can also click on a buttom to delete the settings cookie. If you try to save the settings but the colours are not shown in the 'Saved' column and the cookie expiry date is not displayed, your browser did not save and check the cookie successfully.
The year chart above the map shows relative numbers of records in 3 date periods per month (1st - 10th, 11th - 20th, and 21st - end). Solid black bars indicate records of adults, open orange bars indicate non-adult records: eggs, larvae, pupae, larval or pupal cases, distinctive feeding signs such as leaf mines etc. Open grey bars indicate unspecified/unavailable record type. Position the mouse pointer over a period in the chart to see the numbers of records for that period. As indicated on the screen, you can then use mouse clicks to scroll through the species recorded during that period in order by total number of records (from all years, regardless of map display period). Note: because each type of bar has a minimum height for visibility, a few records of each type can result in a taller combined bar than a lot of records of one type only.
Instead of the usual tetrad scale species distribution map you can select:
For the species density map the time of year chart option results in a chart showing for each year since the year's total number of species increasing throughout the year. Move the mouse pointer over a year to select and highlight its graph, then over a period column to see its species total. Note that these totals are derived only from records supplied with full dates and shown on species year period charts, so the late December totals could be slightly lower than the actual year totals in some cases.
If the altitude chart checkbox is ticked, the year chart above the species map is replaced by a chart showing the number of records made at altitudes of 0-24 metres, 25-49 metres, 50 - 74 metres, ... , 275 - 299 metres and 300 metres or more. Only those records stored with a full grid reference at 100 metre scale (or 10m or 1m) are counted, for the average of the 4 spot heights in the Ordnance Survey data for the recorded hectare. NB In the past many records were converted from 100m to 1Km scale; such records are shown on the maps but not on the altitude charts. The shaded background to the altitude chart shows approximate proportions of the area in each altitude range.
Within the recording area land over the selected height is shaded (Contains OS data © Crown copyright and database right 2018). You can use the mouse wheel to change the selected height, and there are options to show altitudes at 50 or 100 metre intervals (in colours determined from the single height colour).
For the species density map the number of years option initially shows the number of years since for which at least one moth-trapping session during the year produced records for that tetrad. With the mouse pointer over this map, the first and latest such year are shown and the chart above the map indicates the dates of all trapping sessions for the tetrad in the period, with each date counting only once even if there were multiple traps in the tetrad on that date. For the purposes of these maps, use of a light tower is treated as trapping.
When the mouse pointer is moved outside the map the time of year chart has grey bars. If the mouse pointer is moved over one of these bars, the trapping years count map for that time of year is shown. There are also 10 horizontal grey bars to the right of the map, labelled with the last 10 years. If the pointer is moved over one of these, the number of nights trapped during that year is shown for each tetrad.
Please note that some records from trapping might not have been recognised by the tests applied to the records, and conversely some non-trapping records might have contained text which caused them to be treated as from trapping, perhaps causing some errors and omissions on the trapping map and charts. In total more than 77% of all records were identified as coming from trapping, with a total of more than 39,000 tetrad trapping dates during the mapped period.
If you hold down the [Alt] key and click on a map tetrad, OpenStreetMap data is shown for the tetrad and adjacent land, to the right of the optional halfsize display of previously selected species maps. The approximate tetrad boundary grid lines are shown over this map. You can close the tetrad map display by clicking anywhere on it, and while it is displayed there are buttons below it:
To the right of a species map small dots indicate the years starting from 1980 for which records are held in the database (which could include some not mappable to tetrad) for VC34 (West Gloucestershire), VC33 (East Gloucestershire) and for the small parts of present-day Gloucestershire & South Gloucestershire in other VCs. The map axis labels indicate the year, e.g. the dot just above the 10 grid line indicates 2010. Position the mouse pointer over the VC33 or VC34 column to see that VC's species totals for a year, or between the VC34 column and the map axis to see the totals for the whole recording area.
For species with blank maps or no tetrad dots before 2011, a comment box on the map usually indicates reports mentioned in the former Glos. County Moth Recorder Roger Gaunt's 2006 publication "Gloucestershire Moths - A Second Account".
For most species records regarded as unconfirmed by the VC recorder are not mapped, but U-shaped dots are shown on the tetrad maps for some species, with explanatory comments shown on the map. In most cases they show records now considered to be unconfirmed, though not necessarily doubtful. For some pairs or small groups of similar-looking species, all records are shown as U-shaped dots unless they are confirmed by some additional evidence such as dissection, distinctive larva or larval food, etc.
Some comments for macromoths indicate other species in square brackets. These are some of the most likely pairs or groups of species for which mapped records of adults identified from markings without additional confirmation (usually by dissection) probably include some mistakes. Numerous micromoth species can only be identified with certainty by dissection. Records of species forms/subspecies originally given separate Bradley numbers have been included with the main species entry. Comments are added to both maps where a pair of species was recently treated as a single species.
The typical larval food information is derived from several sources, and is probably incomplete &/or inaccurate for a number of species.
UK national status data for our resident macro-moths was updated in 2019 and published in the Atlas of Britain and Ireland's Larger Moths; this uses IUCN regional Red List categories. The status of micro-moths was updated in January 2012 in Butterfly Conservation Report No. S12-02, which uses earlier Red Data Book and Scarce categories. The maps use these published status ratings with few amendments, e.g. following checklist changes.
The abbreviations used here for micro-moths are given in the table below. If selected, the rare & scarce species option includes the categories from RDB1 down to Nb.
| RDB1 | Red Data Book category 1: Endangered species with a single population in one 10Km OS grid square in the UK, or in rapid decline and found in at most 5 10Km squares |
| RDB2 | Red Data Book category 2: Vulnerable species found in at most 10 10Km squares |
| RDB3 | Red Data Book category 3: Rare species found in 11 - 15 10Km squares |
| pRDBn | Provisionally RDBn, yet to be ratified |
| RDBK | Thought to be RDB status, but insufficient knowledge |
| Na | Notable a (Nationally Scarce A): Scarce species found in 16 - 30 10Km squares |
| Nb | Notable b (Nationally Scarce B): Scarce species found in 31 - 100 10Km squares |
| BAP | Biodiversity Action Plan / NERC Act (2006) Section 41 priority species for action. BAP status is independent of any RDB/Na/Nb rating |
| BAP(R) | Biodiversity Action Plan declining species for which research is needed |
| Local | Species found in 101 - 300 10Km squares |
| Common | Species found in more than 300 10Km squares |
| Migrant | Occurs as a result of immigration; may have colonised in the UK |
| Adventive | Occurs as a result of accidental or deliberate import; may have colonised |
The abbreviations used here for macro-moths are given in the table below. Most migrants, adventives and those long extinct in the UK were not assessed in the 2019 review, and their status is described on their map. For macros, the rare & scarce species option includes resident & colonising species recorded from at most 100 UK 10Km squares in 2000-2019, for most species determined from record data to 2019 available via the NBN Atlas website.
| RE | Regionally Extinct. No confirmed records in Great Britain and Ireland for many years |
| CR(PE) | Critically Endangered, Possibly Extinct. Threatened by extremely high risk of regional extinction |
| CR | Critically Endangered. Threatened by extremely high risk of regional extinction |
| EN | Endangered. Threatened by very high risk of regional extinction |
| VU | Vulnerable. Threatened by high risk of regional extinction |
| NT | Near Threatened. Close to qualifying for one of the threatened categories and/or likely to qualify for one in the near future |
| LC | Least Concern. |
| DD | Data Deficient. Status uncertain because of insufficient data on abundance and/or distribution |
The threat ratings above do not necessarily indicate scarcity or rarity, nor vice-versa. Some currently widespread but formerly more abundant species have suffered such long-term population declines that they are rated NT or VU. Some scarce or rare species are not considered to be under threat now or in the near future, and so they are rated LC. Rare, Scarce (A) & Scarce (B) ratings have been included for macros based on the recorded number of 10Km squares in 2000-2019: up to 15, 16-30 and 31-100 respectively. Some species labelled as migrants are resident in the Channel Islands.
In square brackets after the species status, the microlepidoptera verification gradings
issued by Butterfly Conservation in early 2016 and revised in 2025 are given.
These consist of gradings for identification of adults
(except for many of the Nepticulidae which are considered too similar in appearance),
for larval cases of those species which construct them, or for leaf mines of those
species which make them. The gradings below are copied from the
BC Guidance
document, which contains additional guidance.
The species gradings shown on the maps are copied from the
Spreadsheet
which also contains comments on some species which in some cases limit
the applicability of the grading. For species with comments, the + character follows the grading(s)
and the comment is shown below the map.
NB For a few species it was necessary to change the gradings &/or comments from the original versions.
The national gradings of a number of other species may be too low for local purposes if not followed
strictly: e.g. any specimen thought to be new to the county and similar in appearance to a species already
found here might need to be retained and perhaps dissected to be certain of its identity, whatever the
national grading.
In square brackets after the species status, an indication of the macrolepidoptera recording criteria for VC33 issued by Robert Homan in 2014 is given in a similar format to the microlepidoptera guidance. These indicate the details that should be provided to support a record of the relevant species. A photograph in this instance should mimic the view of the moth given in a field guide i.e. in most cases the camera should look straight down on the moth, using a neutral pale background and there should also be an indication of scale. Photographs should be taken in natural light as flash can give a false impression of colour. Please avoid pictures of moths taken in egg boxes - these can distort the impression of size and shape and it is difficult to get a correct balance of light across the subject. Some species cannot be accurately identified unless they are dissected hence the request to retain the specimen. In such cases recorders are welcome to do their own dissecting, but please provide a microscope picture of the results. Particular care should be taken with records of any species with no grading. A photograph might be sufficient to support a new Vice County record, but please retain the specimen until the record has been verified.
Pugs collectively are difficult! Several species have common melanic forms and all of them seem to be especially prone to wear. If there is any doubt then either do not record or retain the specimen for dissection.
Butterfly Conservation produced national verification gradings for macro-moths in 2021. These gradings are not shown on these maps, but they are shown on the South West Region maps.
The VC33 gradings are shown below. For species with a more detailed comment in the criteria, the + character follows the grading(s) and the comment is shown below the map. Please note that there is currently no similar grading list for VC34, and that because of their habitat requirements some species are much less likely to be found in one of the two vice-counties than the other, as indicated on the map. For these species at least, the evidence required for a VC34 record might be different than for VC33, either more or less.
The maps show records which have been provided with Ordnance Survey grid references to 2Km or finer scale, and entered into the computerised databases held by vice-county recorders. They also include some pre-2000 records derived from historical lists containing site names, but in general they do not show the full extent of known pre-2000 distribution.
Mapped record data status for records received by the Gloucestershire Vice-county Moth Recorders (subject to any updates from them):
If you have moth records which are not shown on these maps, please send them to the appropriate Gloucestershire Moth Recorder:
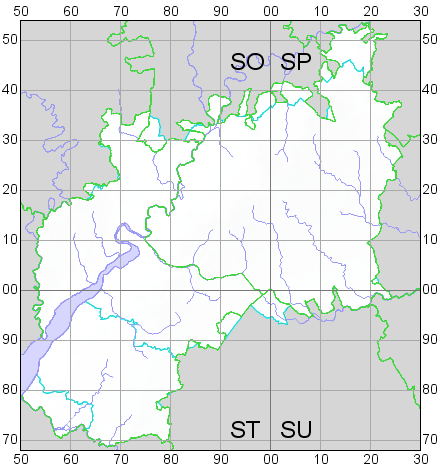
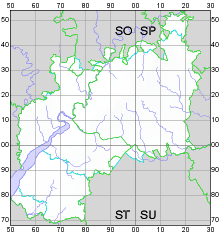
The map shows the recording area: the counties of Gloucestershire and South Gloucestershire, together with those parts of Watsonian vice-counties VC33 (East Glos.) and VC34 (West Glos.) which are outside the current administrative counties. The VC boundaries are shown in green, and where different the Glos. and South Glos. boundaries are coloured cyan. Coastlines and some rivers are shown in blue, and land outside the recording area is coloured grey. Ordnance Survey 10Km grid lines and 100Km square letters are shown.
The Botanical Society of the British Isles has a web page providing a form to give the VC number when you input a grid reference, here preset to show Cleeve Hill: https://database.bsbi.org/gridref.php?ref=so985263.
The VC33 & 34 boundaries are available in the form of simulated GPS track files, for display on the map page of a GPS. They can be downloaded from VC33_34_boundaries.html. Please note the OS Open Data Licence, and the disclaimer.
Complete accuracy of the data is extremely unlikely - with more than 1,000,000 records some errors and omissions are inevitable. Records shown are those supplied to the VC33 & VC34 recorders indicated above, to the former Gloucestershire moth recorders Roger Gaunt (all areas to 2011) and Neale Mellersh (VC34 east of Severn, to 2019), and VC34 records supplied to the Bristol Regional Environmental Records Centre (BRERC) to the year shown above, including some from NBN Atlas occurrence downloads at NBN Atlas accessed on 2 April 2022 and 7 December 2024, under the Creative Commons with attribution non-commercial licence (CC-BY-NC). The macro-moth records from outside and some from within the Glos./VC33/VC34 area are from Butterfly Conservation's National Moth Recording Scheme data to 2019, downloaded from NBN Atlas on 28 & 29 September, 2 & 3 October 2023, also under the CC-BY-NC licence.
There is probably some duplication of records, affecting the year charts but not the distribution maps. Some unconfirmed or probably mistaken records (e.g. northern UK species difficult to separate from species which are found here) and those with insufficient information for mapping purposes have been omitted, and following reviews some records may in future be removed from the database and their distribution dots removed from the online maps. For tetrad dots on the area boundary, some records might have come from just outside the intended recording area. For pairs or groups of species not separable with certainty from wing markings, only those records identified to species have been shown but some of these could be erroneous. Records of 'aggregates' have not been mapped.
Page last revised May 2026
Versions of this moth map page have been visited
times since November 2010
Butterfly Conservation. Company limited by guarantee, registered in England (2206468).
Registered Office: Manor Yard, East Lulworth, Wareham, Dorset, BH20 5QP.
Charity registered in England and Wales (254937) and in Scotland (SCO39268). VAT No GB 991 2771 89