|
Butterfly Conservation |
| Saving butterflies, moths and our environment |
| Butterfly Conservation Home Page |
| BC Gloucestershire Branch Home Page |
| Gloucestershire Moth Distribution Maps |
|
|
| Select species using slider or << >> controls | ||
| or from drop-down species list above | ||
| Loading data - please wait | ||
| Loading data - please wait | ||
| Loading data - please wait | ||
| Loading data - please wait | ||
| Map dot scale: | ||
| Display: | ||
| Chart on the species maps shows record counts: | ||
| Altitude shading on maps: | ||
| - | ||
This page can produce a variety of different displays. If you only want to see where a species had been
recorded during 2011 - 2020, the 1Km scale maps available on the
Butterfly maps
link from the branch home page show this information.
Those maps are also available from this page as the 2011-2020 maximum sightings maps, in addition to all the other options.
If you are also interested in the local distribution of moth species,
2Km scale moth maps are available.
The drop-down box to the top right of the map area gives the species list from which you can make a selection. You can also use the species slider bar above the map to move forwards and backwards through mapped species in Checklist order. Clicking on the [<<] or [>>] button moves backwards or forwards by one species. Alternatively in some browsers you can use the mouse wheel to scroll through the full set of species maps when the cursor is over the graphics area or the species list selection box.
Nomenclature and ordering follows the Checklist of the Lepidoptera of the British Isles (Agassiz, Beavan and Heckford, 2013, with subsequent additions and amendments). The number preceding the scientific name above a species map is the checklist number.
The initial map shows the numbers of species recorded for each 1Km square as one of 10 ranges. This map precedes the first species map when using the slider bar, movement buttons or mouse wheel. To see the total number of butterfly species mapped for a 1Km square, tetrad (2Km square), 5Km square or 10Km square, move the cursor over that square on the map. The numbers for all four square sizes are shown just below the species list box. You can select the distribution scale (1, 2, 5 or 10 Km) by clicking on it or by scrolling the mouse wheel whilst the pointer is over the row of scales.
If you want to compare maps for two species (or more), or to compare the other types of display, you can use the preset buttons. These are updated automatically as you display different species. To cycle through several species for comparison purposes, select each species in turn then repeatedly click on the lowest button for one of these species. Each time you do this the chosen species is moved back to the top button and the others are shifted down by one position so that you always click the same button to see the next species in the comparison group.
For each scale of distribution map, a solid dot on a map indicates that the species was recorded in that square since 2000. The solid blue dots show records from 2015-2022, and red dots show the records from 2023. A hollow grey dot indicates that the most recent record held for the square is pre-2000. You can choose to display the distribution for any of 9 periods: all years, pre-2023, pre-2015, pre-2000, 2000-2014, 2015-2022, 2023, 2015-2023 or 2000-2023. To change this you can use the drop-down list in the period selection choice box, and in some browsers you can also use the mouse wheel when the cursor is over this box. The year chart is based on all records whichever distribution period is displayed. The same period options are available for the initial species density map.
If you have any colour blindness and find that some of the five dot colours used on the various displays are difficult to tell apart, you can select alternative colours which you can save to a cookie so that they are used automatically in future, if your browser settings allow this. Click the [Settings] button to open the colour selection panel which contains instructions. The high ground shading colour can also be changed and saved using this panel.
If you save your chosen settings to a cookie it will expire after 100 (default) or 400 days and it is not renewed automatically, but you can save the settings at any time to reset the expiry date. You can also click on a buttom to delete the settings cookie. If you try to save the settings but the colours are not then shown in the 'Saved' column, your browser did not save and check the cookie successfully.
The year chart above the map shows relative numbers of records in 3 date periods per month (1st - 10th, 11th - 20th, and 21st - end). Solid black bars indicate records of adults, open orange bars indicate non-adult records: eggs, larvae, pupae, pupal cases, distinctive feeding signs etc. Open grey bars indicate unspecified/unavailable record type. Position the mouse pointer over a period in the chart to see the numbers of records for that period. Note: because each type of bar has a minimum height for visibility, a few records of each type can result in a taller combined bar than a lot of records of one type only.
Instead of the usual species distribution map you can select:
If the altitude chart checkbox is ticked, the year chart above a species map is replaced by a chart showing the number of records made at altitudes of 0-24 metres, 25-49 metres, 50 - 74 metres, ... , 275 - 299 metres and 300 metres or more. Only those records stored with a full grid reference at 100 metre scale (or 10m or 1m) are counted, for the average of the 4 spot heights in the Ordnance Survey data for the recorded hectare. The shaded background to the altitude chart shows approximate proportions of the area in each altitude range.
Within the recording area land over the selected height is shaded (Contains OS data © Crown copyright and database right 2018). You can use the mouse wheel to change the selected height, and there are options to show altitudes at 50 or 100 metre intervals (in colours determined from the single height colour).
The typical UK larval food information is derived from several sources, and is unlikely to be 100% accurate and complete.
UK national status data for our resident butterflies was updated in 2021, using IUCN regional Red List categories. The IUCN abbreviations shown on the maps are given in the table below. Some species are also labelled BAP. These are Biodiversity Action Plan / NERC Act (2006) Section 41 priority species for action. BAP status is independent of the IUCN category.
| CR | Critically Endangered. Threatened by extremely high risk of regional extinction |
| EN | Endangered. Threatened by very high risk of regional extinction |
| VU | Vulnerable. Threatened by high risk of regional extinction |
| NT | Near Threatened. Close to qualifying for one of the threatened categories and/or likely to qualify for one in the near future |
| LC | Least Concern. |
The threat ratings above do not necessarily indicate scarcity or rarity, nor vice-versa. Some currently widespread but formerly more abundant species have suffered such long-term population declines that they can be rated NT or VU. Some scarce or rare species might not be considered to be under threat now or in the near future, in which case they would be rated LC. Species are labelled as Rare, Scarce (A) or Scarce (B) depending on the number of UK 10Km OS grid squares from which they were recorded during 2010 - 2019: up to 15, 16 - 30 or 31 - 100 squares respectively.
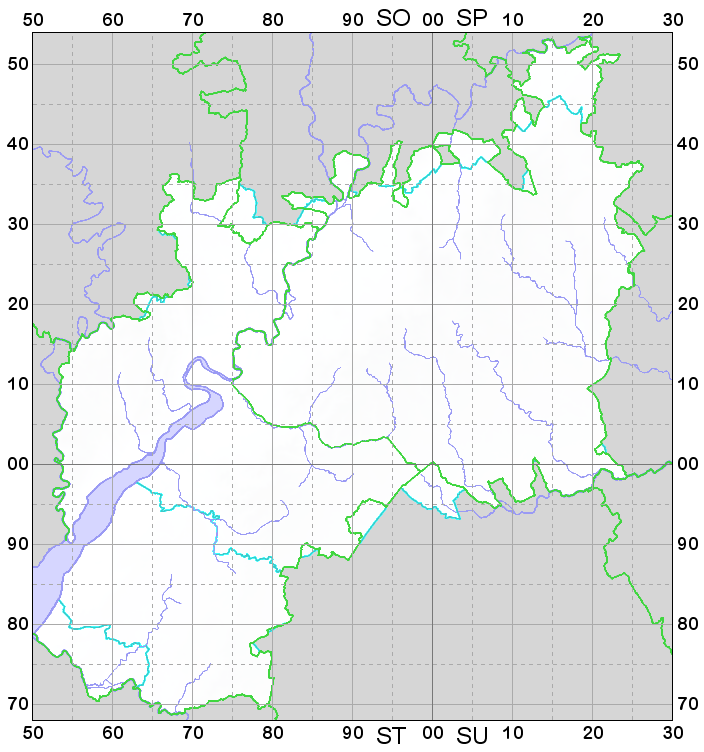
This map shows records held by the Butterfly Recorder for the Gloucestershire Branch of Butterfly Conservation. These are mostly from present-day Gloucestershire, but some records from 'wider Gloucestershire' are included: present-day South Gloucestershire, and parts of the old Watsonian vice-counties VC33 (East Glos.) and VC34 (West Glos.) which are outside the current administrative counties.
On the maps the VC boundaries are shown in green, and where different the Glos. and South Glos. boundaries are coloured cyan. Coastlines and some rivers are shown in blue, and land outside the recording area is coloured grey. Ordnance Survey 10Km grid lines and 100Km square letters are shown.
Complete accuracy of the data is extremely unlikely - with more than 300,000 records some errors and omissions are inevitable. In particular, many records from parts of the mapped area which are not in present-day Gloucestershire may not have reached the Glos. branch Butterfly Recorder in which case they are not shown on the maps. Some unconfirmed records and those with insufficient information for mapping purposes have been omitted. For dots on the area boundary, some records might have come from just outside the intended recording area. The pre-2000 data is limited to resident species and common migrants, so old records of rare migrants are not mapped. Please note that some dots on the maps can result from specimens straying well beyond their normal habitat, from deliberate releases, or from accidental misidentifications.
Page last revised April 2025
Butterfly Conservation. Company limited by guarantee, registered in England (2206468).
Registered Office: Manor Yard, East Lulworth, Wareham, Dorset, BH20 5QP.
Charity registered in England and Wales (254937) and in Scotland (SCO39268). VAT No GB 991 2771 89